Keeping Things Simple
Much has been written about using fancy technologies like artificial intelligence, machine learning, and predictive analytics in the workplace to do everything from identifying the most effective project managers to making recommendations on Netflix. Too often, the reader is left with the impression that the technology is only available in high-end, hard-to-implement, black box systems attainable only by businesses willing to hire a small army of very specialized data scientists.
I thought I’d try to dispel that myth by presenting a case study of how to forecast revenue using predictive analytics. I’ll talk about how we created a proof of concept using nothing fancier than Excel, and how that initial prototype can be extended further into a truly dynamic predictive analytics-based revenue forecasting model.
Dealing with the Hard Stuff
A few weeks ago, I was speaking with an old friend who was starting to do a lot of work with artificial intelligence, machine learning, and predictive analytics. He mentioned that the technology in play was actually one of the easier pieces of the puzzle.
The harder aspects to get right were making sure we were asking the right questions in the first place, figuring out how to prep the data to feed into the analytical models, and interpreting the results at the end of the day. These harder aspects require not just an isolated understanding of the analytical techniques, but demand a sound knowledge of the business problem at hand as well.
In that spirit, here I’ll focus more on the concepts around the business problem we were trying to solve rather than the mechanics of the analysis. This works especially well since the quantitative skills required relating to how to forecast revenue here are not much more than what a college freshman might learn in Statistics 101.
Understanding the Business Problem
OK, so to the problem at hand: our company, BigTime, builds professional services automation software used by consulting firms, digital marketing agencies, and technology implementers to run their businesses.
These types of companies succeed or fail based on how efficiently they are able to provide their high-end, knowledge-based labor to their clients. As such, they put a lot of effort into projecting their labor and resourcing needs into the future and translating those staffing needs into strategic hiring plans, professional development programs, and human resourcing strategies.
These professional services firms also translate their labor and resourcing needs into future revenue projections that help the organization understand whether they can support the costs of additional hiring or professional development with their anticipated revenue. These revenue projections are also continually evaluated to see how accurately they portrayed the future once those forecasted periods have already passed.
Collecting the Data
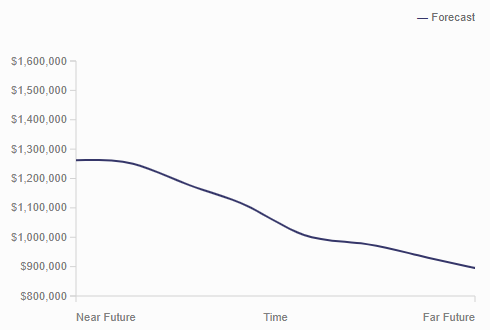
When it comes to how to forecast revenue, our first step in building a predictive analytics-based model was collecting lots of data about how the organization was currently performing. We started by taking a snapshot of what the current revenue forecast was for the next six months into the future.
Over the course of the next six months, we refreshed that data each week as the forecasts were refined and updated. Finally, as each of the forecast periods passed, we measured what the revenue ended up actually being.
This gave us a picture of forecasted revenue, actual revenue, how much forecasts changed on average at differing planning horizons, and how much variation existed within the forecasts. (Not important to the narrative here, but it’s not actually necessary to wait to conduct the study over the course of eight physical months if the systems you have in place can provide historical perspectives of what forecasts were after the fact. That’s the actual technique we used, but the concept is the same either way.)
Crunching the Numbers
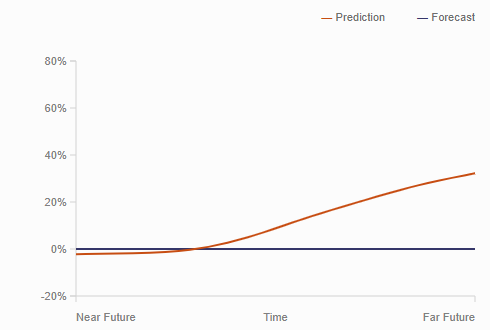
With all the data collected, we were able to “normalize” the data by creating multiple instances of the actual revenue generated for a period compared to what the forecasted revenue for that period was one month in advance, two months in advance, etc. With enough instances of data collected for the next step in how to forecast revenue, we could then compute average ratios of forecasted to actual revenue for each of the planning horizons. This represented an average variance to the predicted revenue.
With the same data, we also calculated standard deviations of this same ratio to understand the variation in the predicted revenue. Doing this analysis using the data collected during the finite period of the study provides a useful, if static picture of how predicted revenue differs from forecasted revenue.
Building the Model
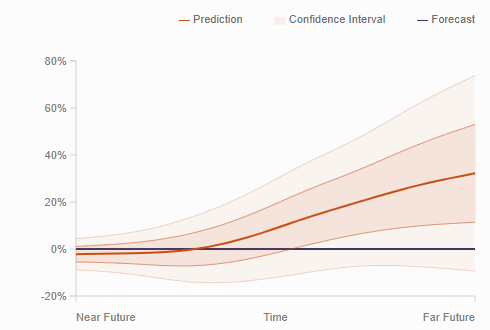
Once we understood how the average variance and variation behaved over different planning horizons, we were able to use the standard deviation to calculate confidence intervals at the one- and two-σ levels around the predictions. These confidence intervals expressed ranges that the model would expect would be achieved at 66% and 95%, respectively, of the time, based on historical performance.
This creates a cone very similar to what meteorologists use to predict the path of a storm. As with storm track predictions, the zone of uncertainty typically widens at longer planning horizons since it’s much easier to predict the near term than it is the far future.
Applying the Model
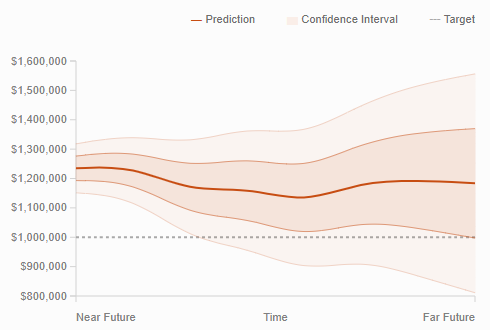
With a model of predicted averages and confidence intervals expressed as ratios of predicted to forecasted revenue, we can then apply those ratios to the current bottom-up revenue forecast that is based on known, committed work. Applying the predicted averages uses historical performance to translate known revenue into predicted revenue based on how the organization has identified or won new business in the past.
Applying the one- and two-σ bands shows how confident the organization can be with these predictions based on how much variation the system has displayed in the past. These predicted ratios can be applied to the latest revenue forecast however often the forecast is updated.
How to Forecast Revenue Using Fully Dynamic Predictive Analytics
While the snapshot-in-time technique of calculating the ratios representing variance and variation can provide a great predictive analytics-based revenue forecast, they won’t necessarily take into account material changes in the behavior of the system.
For instance, if the organization builds a Resource Management Office to improve its accuracy in projecting resourcing needs, those improvements would be expected to show up as less variation, or a lower standard deviation. A fully dynamic system would continually monitor the behavior of the system and update the model with the latest performance data. In truth, simply taking new snapshots and recalculating the variance and variation perhaps every quarter, would probably be more than enough for most organizations.
Understanding the Key
As I described, the actual analytics and mathematics involved are really quite straightforward and only require some basic knowledge of statistics when it comes to how to forecast revenue. The key to this whole process, which I glossed over a bit above, is being able to gather trustworthy, consistent, clean data that can be fed into the analysis.
For a professional services firm, the foundational financial and operational system that provides this sort of data is a professional services automation tool like BigTime. It provides a single system that consistently builds revenue forecasts from resourcing projections and also tracks actual revenue generated from effort expended.
In this way, it not only provides the tools to automate the mundane aspects of running a professional services business, it helps organizations take their performance to the next level by enabling perhaps more interesting analyses such as this predictive analytics-based revenue forecast model.
Learning More
If you’re interested in learning more about PSA software for services organizations, take a look at our e-book, Professional Services Automation: A Quick Primer. In it, you’ll find additional information about how Professional Services Automation software can improve the performance of a services organization. You’ll also see information about some of the decision points you’ll need to make when selecting a PSA software, some of the trends we’re seeing in the PSA market, and much more.
Frequently Asked Questions About How to Forecast Revenue
What are the steps for how to forecast revenue?
The steps to use for how to forecast revenue using predictive analytics include:
1. Set targets
2. Predict variance
3. Measure variation
4. Increase confidence
5. Apply the variance model
6. Apply variation
7. Compare to target
8. Increase confidence
9. Forecast revenue using predictive analytics


.png)
